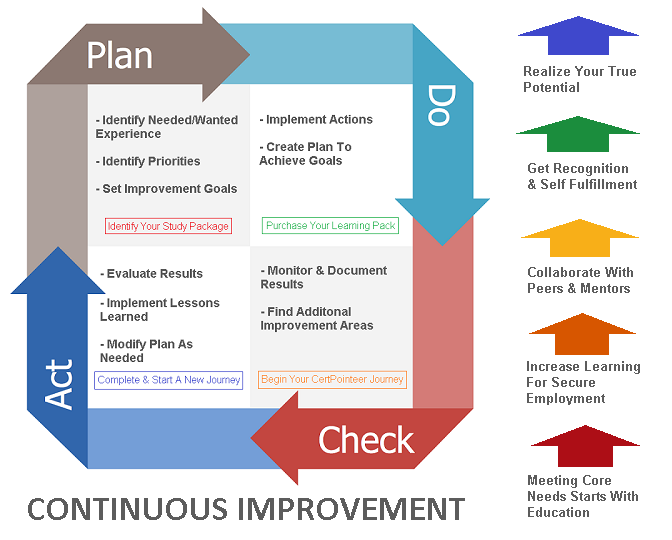
"The premise here is that by closing the knowledge-experience gaps will assist in each student becoming more confident and self -sufficient and achieve maximum benefit from the program while completing college courses. Students will locate their initial "field of interest" sooner."
[Training Pkg #CPTRAINPKG0095a] Get The ChatGPT Guide Package
(35 purchase(s) during the period from 4/1/2024 to 6/31/2024)
Training Packages Available Quarterly: 40
$20.00
[See All Reviews]
[Training Pkg #CPTRAINPKG0095b] Get The ChatGPT Guide Package (Level II)
(17 purchase(s) during the period from 4/1/2024 to 6/31/2024)
Training Packages Available Quarterly: 40
$50.00
[See All Reviews]
FOR EDUCATORS: Get The ChatGPT Guide Package
(25 purchase(s) during the period from 4/1/2024 to 6/31/2024)
Training Packages Available Quarterly: 40
$89.00
[See All Reviews]


| Career Readiness, Growth, & Development Insights |
|
|
|
REGION1 Experience Builders (Posted): eCommerce / Consignment Shop Design Budget: $200-$700 -> 3 STUDENT Proposals JOIN In? VIEW All Region 1 Opportunities CREATE An Opportunity May 2025 Stats -> 68 NEW Opportunities Available Today -> 40 Work Experience Builders In Progress MONTHLY TOP SCHOOL: University of the Pacific (CA) MONTHLY TOP Business: T-Mobile USA MONTHLY TOP Experience: Website Management |
|
REGION2 Experience Builders (Posted): IT Apprenticeship (3rd & 4th Quarter) Budget: $0-$0 -> 0 STUDENT Proposals UPLOAD Proposal? VIEW All Region 2 Opportunities CREATE An Opportunity May 2025 Stats -> 58 NEW Opportunities Available Today -> 49 Work Experience Builders In Progress MONTHLY TOP SCHOOL: University of Central Oklahoma (OK) MONTHLY TOP Business: Hewlett Packard Corp. MONTHLY TOP Experience: Graphic Design |
|
REGION3 Experience Builders (Posted): HELP: Need assistance for email setup for iphone/desktop Budget: $0-$50 -> 0 STUDENT Proposals UPLOAD Proposal? VIEW All Region 3 Opportunities CREATE An Opportunity May 2025 Stats -> 43 NEW Opportunities Available Today -> 41 Work Experience Builders In Progress MONTHLY TOP SCHOOL: DePaul University (IL) MONTHLY TOP Business: Workiva MONTHLY TOP Experience: Website Management |
|
REGION4 Experience Builders (Posted): Earn 25 CPNTcoin - Provide The Correct Answer To The Following Certification Question. Budget: $0-$0 -> 0 STUDENT Proposals UPLOAD Proposal? VIEW All Region 4 Opportunities CREATE An Opportunity May 2025 Stats -> 41 NEW Opportunities Available Today -> 23 Work Experience Builders In Progress MONTHLY TOP SCHOOL: Old Dominion University (VA) MONTHLY TOP Business: VantagePoint AI MONTHLY TOP Experience: Data Analyst |
|
REGION5 Experience Builders (Posted): Graphics Student Needed For Logo Design - University of Vermont - University of Southern Maine Budget: $200-$450 -> 31 STUDENT Proposals JOIN In? VIEW All Region 5 Opportunities CREATE An Opportunity May 2025 Stats -> 51 NEW Opportunities Available Today -> 33 Work Experience Builders In Progress MONTHLY TOP SCHOOL: Northeastern University (MA) MONTHLY TOP Business: Guardicore MONTHLY TOP Experience: Graphic Design |
|
REGION6 Experience Builders (Posted): Graphic Designer/Illustrator Needed Budget: $125-$200 -> 1 STUDENT Proposals JOIN In? VIEW All Region 6 Opportunities - CREATE An Opportunity May 2025 Stats -> 39 NEW Opportunities Available Today -> 26 Work Experience Builders In Progress MONTHLY TOP SCHOOL: Heidelberg University (Germany) MONTHLY TOP Business: Volkswagen MONTHLY TOP Experience Gained: Website Management |
|
|
 |
|
Popular Tutorials For Learning: - How To Write A Resume - CompTIA A+ Complete Study Guide -> [Advanced] - Building Dashboards Tutorials - Advanced Microsoft Excel -> [Hands-On] - Windows Powershell Cookbook 3rd Edition - Python Tutorial -> [Hands-On] - How To Use Twitter For Business - View All Tutorials |
Available Cert Exams: Music Licensing Take An Online Exam |
Virtual Courses: On Demand: Client & Server Architecture All Courses (Region 3) |
|
Recent Members' CollabTalk: |
Recent Water Cooler Discussion Topics: HelpDesk Website Design Illustrator HelpDesk Fitness IT Security Ready To Contribute? |
|
Term Of The Day: Personal Learning Network (PLN) |
| Interactive Analytics |
| Course-2-Job Role Compatibility | Work Experience Builders | by CertificationPoint |
|---|---|---|
| YPRO 184 Intro to Entrepreneurship | ART 250 3-D Design | AMFG 104 Automation |
| ACCT 212 Computerized Accounting | AMFG 202 Introduction to Lean Manufacturing and Six Sigma | AMFG 210 Computer Aided Manufacturing |
| BADM 102 Customer Service Skills | BADM 105 General Business Administration | BADM 108 Finance |
| BADM 110 Records and Information Mgmt | BADM 112 Business English | BADM 113 Business Mathematics |
| BADM 115 Office Procedures | BADM 201 Principles of Macroeconomics | BADM 202 Principles of Microeconomics |
| BADM 203 Business Statistics | BADM 208 Entrepreneurial Finance | BADM 212 Principles of Management |
| BADM 213 Human Resource Management | BADM 214 Principles of Marketing | BADM 215 Business Law |
| BADM 216 Small Business Entrepreneurship | BADM 217 Organizational Behavior | BADM 220 Business Communications |
| BADM 221 Business Professional Speaking | BADM 230 Money and Banking | BADM 240 Business Analytics |
| BADM 299 Business Internship | YPRO 101 NRF Customer Service Certif. | YPRO 102 Property & Casualty Insurance |
| YPRO 104 How To Run Effective Meetings | YPRO 105 Notary Public Exam Preparation | CTEC 100 Computer Concepts |
| CTEC 101 Information Technology Principles | CTEC 102 Problem Solving and Programming Techniques | CTEC 104 Introduction to Scripting |
| CTEC 107 Skills for Information Technology (IT) Success | CTEC 108 Introduction to Management Information Systems | CTEC 110 Ethics in Information Technology |
| CTEC 111 Internet Technology | CTEC 112 IT Hardware Support | CTEC 113 Introduction to C++ Programming |
| CTEC 114 IT Software Support | CTEC 115 Software Applications | CTEC 118 Help Desk Operations |
| CTEC 119 HDI Sprt Ctr Analyst | CTEC 125 Fiber Optics I | CTEC 126 Fiber Optics II |
| CTEC 127 Fiber Optics III | CTEC 130 HTML5/CSS3 | CTEC 144 Advanced MS Word |
| CTEC 145 Advanced MS Excel | CTEC 146 Advanced MS PowerPoint | CTEC 147 Advanced MS Access |
| CTEC 149 Web Scripting | CTEC 150 Introduction to Programming with JAVA | CTEC 151 Advanced Java Programming |
| CTEC 155 Network Essentials | CTEC 165 Introduction to Virtualization | CTEC 170 Microsoft Windows Servers |
| CTEC 172 Linux Server | CTEC 200 Network Defense | CTEC 210 Advanced Network Topics |
| CTEC 213 Advanced C++ Programming | CTEC 220 Information System Security I | CTEC 224 Information System Security II |
| CTEC 235 Mobile App Development | CTEC 240 Internet Protocol (IP) Telephony | CTEC 243 Data Structures |
| CTEC 250 Programming with C# | CTEC 255 CCNA I | CTEC 256 CCNA II |
| CTEC 257 CCNA III | CTEC 258 CCNA IV | CTEC 259 Server-Side Web Development |
| CTEC 260 Interactive Program Design | CTEC 262 Introduction to Cloud Computing | CTEC 263 Cloud+ |
| CTEC 264 Advanced Cloud Computing | CTEC 270 Relational Database Coding | CTEC 272 Advanced Topics in Linux |
| CTEC 274 Data Analytics | CTEC 275 Big Data | CTEC 279 Information Assurance |
| CTEC 280 Computer Forensics | CTEC 282 Information Technology Project Management | CTEC 285 Health Informatics for IT Professionals |
| CTEC 287 Network Security Design | CTEC 290 System Analysis and Design | CTEC 295 The Software Development Process |
| CTEC 297 Advanced Topics | CTEC 299 CTEC Internship | YINF 101 Google IT Support Professional |
| YINF 102 Microsoft Word, Basic | YINF 103 QuickBooks, Beginning | YINF 104 Microsoft Excel, Basic |
| YINF 111 QuickBooks, Intermediate | YINF 112 Cyber Essentials Workshop | COMM 102 Live Video Productions |
| COMM 105 Survey of Music Business | COMM 107 Sound Reinforcement | COMM 108 Marketing of Recorded Music |
| COMM 109 Introduction to Audio Editing | COMM 111 Engineering for Comm Media | COMM 120 Digital Media Survey |
| COMM 125 Media Literacy | COMM 130 Film Pre-Production | COMM 135 Design for Media |
| COMM 141 Social Media Marketing | COMM 150 Video Production Techniques | COMM 153 Acting for Media |
| COMM 160 Photography | COMM 163 History of Photography | COMM 170 Introduction to Mass Media |
| COMM 171 The Business of Visual Artistry | COMM 201 Video Post-Production | COMM 202 Video Editing |
| COMM 203 Lighting Fundamentals | COMM 204 Special Effects in Editing | COMM 207 Electronic Field Production |
| COMM 209 Scriptwriting for Film and Television | COMM 210 Fundamentals of Advertising | COMM 211 Newswriting |
| COMM 212 Announcing | COMM 213 Voice and Diction | COMM 215 Special Topics |
| COMM 216 Adobe Photoshop | COMM 218 Adobe Illustrator | COMM 219 Applied Graphic Design |
| COMM 220 Compositing | COMM 223 Publication Design | COMM 225 Audio Production in Media |
| COMM 228 Bridging Digital and Traditional Fine Art Techniques | COMM 230 Communication Internship | COMM 236 3D Modeling |
| COMM 239 Motion Graphics | COMM 240 American Cinema | COMM 246 Introduction to 2D Animation |
| COMM 248 Visual Storytelling | COMM 251 3D Animation | COMM 256 Multimedia Journalism |
| COMM 258 Media Portfolio | COMM 259 Media Ethics | COMM 260 Event Photography |
| COMM 267 Photography II | COMM 270 Commercial Photography | COMM 280 Digital Cinema Production |
| COMM 281 Documentary Filmmaking | COMM 282 Applied Film Production | COMM 283 Applied Film Production II |
| COMM 290 Pro Tools | COMM 294 Studio Production | COMM 299 Sound Design for Film and Video |
| YINF 114 Adobe Photoshop | YINF 115 Adobe Illustrator | HCM 201 Introduction to Healthcare Management |
| HCM 202 Healthcare Informatics | TEED 101 Fundamentals of Electricity and Lab I | TEED 102 Fundamentals of Electricity and Lab II |
| TEED 103 Residential Wiring | TEED 104 Electrical Raceways | TEED 105 Basic Process Control |
| TEED 132 National Electrical Code | TEED 140 Technical Drawing with Engineering Graphics | TEED 142 Print Reading for Engineering and Manufacturing |
| TEED 143 Introductory Computer Drafting | TEED 144 Intermediate Computer Drafting | TEED 145 Industrial Mechanical Theory |
| TEED 146 Industrial Mechanical Theory II | TEED 149 Fluid Power | TEED 150 Pneumatics |
| TEED 151 Power Transmission Technology | TEED 153 Hydraulics/Fluid Dynamics with Lab | TEED 156 Customizing AutoCAD |
| TEED 158 Computer Drafting Applications and Laboratory | TEED 160 3D Computer Drafting | TEED 161 Solid Works 3D |
| TEED 162 Inventor | TEED 171 Building Information Modeling I | TEED 172 Building Information Modeling II |
| TEED 200 Intro to PLC’s | TEED 201 Introduction to Digital Electronics and Programmable Logic Controllers | TEED 202 Intro to Microprocessors |
| TEED 203 Intro to Ind Cont, Comp & Equip | TEED 205 Millwright | TEED 206 Electronics Equipment and Repair |
| TEED 207 Basic Machining | TEED 208 Intermediate Programmable Logic Controllers (PLCs) and Lab | TEED 210 Robotic Control Systems |
| TEED 220 Advanced Solid Works 3D | TEED 230 Generators & Transformer OPS | TEED 252 Electric Motor Controls and Laboratory |
| TEED 260 Mechatronics Level I | TEED 262 Mechatronics Level II | TEED 264 Intermediate Siemens PLC & Lab |
| TEED 280 Industrial Technology Internship | TEED 282 Industrial Engineering Technology Field Experience | YCOS 101 Journeyman Electr. Exam Prep |
| YCOS 102 NCCER Core Curriculum | YMAU 101 Industrial Readiness Training | YMAU 162 Lean Six Sigma Green Belt TM |
| YPRO 109 2-D Design | ENTR-260 INNOVATIVE VENTURE RESEARCH | ENTR-402 BUSINESS DESIGN PROJECT I |
| ENTR-403 BUSINESS DESIGN PROJECT II | ENTR-404 BUSINESS DESIGN PROJECT III | ENTR-410 ENTREPRENEURSHIP FOR HIGH TECH START-UPS |
| ENTR-430 INNOVATIVE PRODUCT DESIGN | ENTR-460 INNOVATIVE VENTURE RESEARCH | ENTR-501 TECH TRANSFER&COMMERCIALIZATION |
| ENTR-502 BUSINESS DESIGN PROJECT I | ENTR-503 BUSINESS DESIGN PROJECT II | ENTR-550 DIR STUDY IN ENTREPRENEURSHIP |
| ENTR-510 ENTREPRENEURSHIP/NEW VENTURE CREATION | ENTR-560 INNOVATIVE VENTURE RESEARCH | BUSN-110 INTRODUCTION TO BUSINESS |
| BUSN-550 DIRECTED STUDY IN BUSINESS | BUSN-501 GLOBAL PERSPECTIVES IN MGMT | BUSN-686 STATISTICAL TOOLS QUALIFY EXAM |
| BUSN-651F RESEARCH AND DISSERTATION | MGMT-333 OPERATIONS MANAGEMENT | MGMT-310 MANAGEMENT OF ORGANIZATIONS |
| MGMT-340 SMALL BUS MGT ENTREPRENEURSHIP | MGMT-360 INTRO TO LDRSHP & LDRSHP DEVELOP | MGMT-370 HUMAN RESOURCE MANAGEMENT |
| MGMT-400 ENTREPRENEURSHIP/NEW VENTURE | MGMT-402 INTERNSHIP IN MANAGEMENT II | MGMT-405 INTERN IN SUPPLY CHAIN MGMT I |
| MGMT-468 HUMAN RESOURCE MGMT FOR ENTREPRENEURS | MGMT-478 STAFFING ORGANIZATIONS | MGMT-494 MANAGEMENT PRINCIPLES |
| MGMT-485 INTERNATIONAL BUSINESS MGMT | MGMT-540 PRINCIPLED BUSINESS LEADERSHIP | MGMT-537 HUMAN RESOURCES MANAGEMENT |
| MGMT-544 ADV PRODUCTION & OPERATIONS MGMT | MGMT-595 ADMINISTRATIVE POLICY | MGMT-604 PREPARING PUBLISHABLE RESEARCH |
| MGMT-610 CURRENT RESEARCH ISSUES IN MGMT | MGMT-671 ORGANIZATIONAL BEHAVIOR | MGMT-660 MATERIALS MANAGEMENT |
| MKTG-300 MARKETING PRINCIPLES & POLICIES | MKTG-301 APPLIED MARKETING STUDIO | MKTG-365 DIGITAL AND CONTENT MARKETING |
| MKTG-401 INTERNSHIP IN MARKETING I | MKTG-420 MARKETING COMMUNICATION | MKTG-473 MARKETING STRATEGY |
| MKTG-482 MARKETING RESEARCH | MKTG-620 ADVANCED TOPICS IN MKTG MGMT | CIS-110 COMPUTER TOOLS FOR BUSINESS |
| CIS-125 IT SOLUTIONS FOR BUSINESS | CIS-310 PRINCIPLES OF INFO SYSTEMS | CIS-315 PROB SOLV & INTRO TO PROGRAMMING |
| CIS-323 DATABASE SYSTEM MANAGEMENT | CIS-325 ENTERPRISE SYS AND INTEGRATION | CIS-335 APPLICATION DEVELOPMENT-INTERNET |
| CIS-337 BUS APP DEV CURRENT PROG TECH | CIS-401 INTERNSHIP IN CIS I | CIS-402 INTERNSHIP IN CIS II |
| CIS-405 BUSINESS ANALYTICS | CIS-421 INTRO TO INFORM SYS ASSURANCE | CIS-422 INCIDENT RESP&COMPUTER FORENSICS |
| CIS-423 DISASTER RECOVERY&BUS CONTINUITY | CIS-424 INFORM SYS ASSURANCE RISK ANALY | CIS-425 PRINCIPLES OF CRYPTOGRAPHY |
| CIS-444 NETWORK DESIGN & IMPLEMENTATION | CIS-449 INFORMATION TECH PROJECT MGT | CIS-450 SYSTEMS ANALYSIS, DESIGN, & IMPL |
| CIS-460 TRENDS IN COMPUTER INFORM SYS | CIS-485 INTERNATIONAL INFORMATION SYS | CIS-505 BUSINESS ANALYTICS |
| CIS-494 PRINCIPLES OF INFORMATION SYS | CIS-510 INFORMATION RESOURCE MANAGEMENT | CIS-523 DISASTER RECOVERY&BUS CONTINUITY |
| CIS-524 INFORM SYS ASSURANCE RISK ANALY | CIS-544 NETWORK DESIGN & IMPLEMENTATION | CIS-547 SYSTEMS INTEGRATION AND ERP |
| CIS-548 ELECTRONIC COMMERCE | CIS-549 INF TECH PROJECT MANAGEMENT | CIS-646 SEMINAR IN IS RESEARCH II |
| CIS-645 SEMINAR IN IS RESEARCH I | CIS-643 ADVANCED DATA COMMUNICATIONS | CYTC-505 FOUNDATIONS IN CYBER FORENSICS |
| CYTC-506 ADVANCED INTRUSION ANALYSIS | CYTC-507 ADVANCED LOG ANALYSIS | CYTC-509 ADVANCED MALWARE ANALYSIS |
| CYTC-511 LARGE DATA SET FORENSICS | CYTC-512 CYBER SECURITY AND RISK MGMT | CYTC-513 NETWORK OPERATIONS AND SECURITY |
| CYTC-514 ANALYTICAL METHODS IN CYBER | CYTC-515 UNDERCOVER CYBER INVESTIGATIONS | CYTC-516 CYBER INSIDER THREAT ANALYSIS |
| CYTC-517 PRACTICUM IN CYBER TECHNOLOGY | EMGT-411 THEORY & APP OF LEAN MFG & MGT | EMGT-414 STAT ANALYSIS FOR SIX SIGMA |
| EMGT-518 PROJECT MANAGEMENT | EMGT-509 ECONOMICS AND DECISION MAKING | EMGT-507 ENGINEERING ADMINISTRATION |
| EDLE-500 RESEARCH APPL FOR EDUC LEADERS | EDLE-501 CURR DEV & ASSESS PLAN/EDUC LDRS | EDLE-540 ORG BEHAV & INNOV LEADERSHIP |
| EDLE-530 PROFESSIONAL DEVELOPMENT | EDLE-593 LEAD W/TECH FOR ADMINISTRATORS | EDLE-562 INTERNSHIP IN EDUC LEADERSHIP I |
| EDLE-705 IMPROVEMENT AND ACCOUNTABILITY | EDLE-778 ADVANCED RESEARCH DESIGN | MIS 325 Database Management |
| MIS 171 Web Technologies and Innovation | MIS 250 Managing Information Technology | MIS 271 Business Systems Development |
| MIS 322 Enterprise Business Process Analysis | MIS 325 Enterprise Business Development | MIS 372 [M] Data Management |
| MIS 374 Information Technology Infrastructure and Security | MIS 400 Strategic Information Systems Leadership | MIS 420 Business Intelligence |
| MIS 421 Business Intelligence Strategy | MIS 426 Emerging Topics | MIS 441 Global E-Commerce |
| MIS 448 Global IS Project Management | MIS 498 Management Information Systems Internship | MIS 557 Designing Business Intelligence Systems |
| MIS 572 Database Management Systems | MIS 574 Telecommunications and Networking in Business | MIS 575 Electronic Commerce and the Internet |
| MIS 576 Emerging Technologies | MIS 580 Information Systems Management | MIS 582 Systems Analysis and Design |
| MIS 595 MIS Research Foundations | ACCTG 231 Introduction to Managerial Accounting | B_A 100 Introduction to Business |
| B_A 211 Ethics, Teams, and Innovation | B_A 212 Spreadsheets, Data Visualization, and Decision Analysis | ENTRP 489 Entrepreneurial Management |
| ENTRP 492 [CAPS] Small Business Strategy and Planning | ACCT 207 Accounting I | ACCT 208 Accounting II |
| BUAD 302 Marketing Research | BUAD 476 Marketing Analytics | BUAD 471 Advertising and Media Management |
| BUAD 472 Marketing, Society and the Environment | BUAD 473 Consumer Behavior | BUAD 474 Marketing Channels and Retailing |
| BUAD 477 Digital Marketing | IS 101 Introduction to Information Systems | IS 210 Introduction to Programming Methodology |
| IS 330 Strategic Management of Technology and Innovation | IS 335 Business Analytics | IS 370 Systems Analysis and Design |
| IS 372 Information Management-Research Methods and Tools | IS 376 Information Systems Architecture | IS 378 IS Project Management |
| IS 380 Object-Oriented Programming | IS 383 Business Intelligence | IS 389 Advanced Business Systems Development |
| IS 438 Web Application Development | IS 463 IS Project Feasibility Study and Proposal | IS 468 Telecommunication and Security |
| IS 471 Big Data Analytics in Business | IS 475 Database Design and Implementation | IS 476 Database Administration |
| IS 478 Advanced Data Communications | IS 480 Internship in Information Systems | IS 484 IT Sourcing and Contract Management |
| IS 485 Seminar in Information Systems | IS 486 Seminar in Information Systems II | IS 489 Advanced Business Analytics |
| IS 490 Independent Study in Information Systems | IS 491 Senior Culminating Project | IS 495 IS Development and Management |
| COM 101 Oral Communication | COM 102 Introduction to Interpersonal Communication | COM 104 Critical Thinking in Public Argument |
| COM 105 Intercollegiate Debate and Forensics I | COM 106 Intercollegiate Debate and Forensics II | COM 116 Critical Reasoning in Daily Life |
| COM 133 Culture and Communication | COM 203 Advanced Public Speaking | COM 205 Intercollegiate Debate and Forensics III |
| COM 206 Intercollegiate Debate and Forensics IV | COM 211 Introduction to Rhetorical Research | BGES 201 Entrepreneurial Creativity |
| BGES 202 Innovation and Teams | BGES 301 Starting Entrepreneurial Organizations | BGES 302 Growing Entrepreneurial Organizations |
| BGES 430 International Entrepreneurship | BGES 431 International Seminar | BGES 440 Sustainability and Entrepreneurship |
| BGES 441 Social Entrepreneurship | BUS 101 Introduction to Business | BUS 103 First-Year Seminar Business Connections |
| BUS 321 Business Communication | BUS 395 Current Issues in Business | BUS 481 Business Internship |
| BUS 490 Individual Study | BUS 496 Strategic Management and Policy | BUS 498 Global Business Strategy |
| CS 115 Introduction to Computers | CS 117 Programming for Scientists and Engineers | CS 135 Computer Science I |
| CS 138 Programming for Data Science in Python I | CS 140 Computing Languages | CS 201 Linux Fundamentals |
| CS 202 Computer Science II | CS 218 Introduction to Systems Programming | CS 219 Computer Organization |
| CS 238 Programming for Data Science in Python II | CS 270 Introduction to Internet & World Wide Web | CS 270L Introduction to Internet & World Wide Web Lab |
| CS 301 Social Implications of Computer Technology | CS 302 Data Structures | CS 326 Programming Languages, Concepts and Implementation |
| CS 338 Data Science Data Structures | CS 341 Internet Programming | CS 341L Internet Programming Lab |
| CS 351 Introduction to Multimedia | CS 351L Introduction to Multimedia Lab | CS 370 Operating Systems |
| CS 405 Analysis and Presentation | CS 417 Introduction to Computer Simulation | CS 420 Human-Computer Interaction |
| CS 422 Introduction to Machine Learning | CS 437 Building Applications in the Cloud | CS 441 Advanced Internet Programming |
| CS 441L Advanced Internet Programming Lab | CS 442 Cloud Computing | CS 443 Information Assurance |
| CS 445 Internet Security | CS 448 Computer Security | CS 449 Computer and Network Forensics |
| CS 451 Multimedia Systems Design | CS 451L Multimedia Systems Design Laboratory | CS 456 Automata and Formal Languages |
| CS 457 Database Management Systems | CS 458 Introduction to Data Mining | CS 460 Compiler Construction |
| CS 463 Computer Architecture | CS 465 Computer Networks I | CS 466 Computer Networks II |
| CS 469 Introduction to Digital Image Processing | CS 470 Networks and Distributed Systems | CS 471 Program Derivation |
| CS 472 Software Product Design and Development I | CS 473 Software Product Design and Development II | CS 474 Decision Environments for Software Product Development |
| CS 477 Analysis of Algorithms | CS 480 Computer Graphics | CS 482 Artificial Intelligence |
| CS 488 Big Data Analytics | CS 489 Advanced Computer Science Topics | CS 490 Independent Study |
| CS 494 Internship in Computer Science | CS 495 Senior Project Development I | CS 496 Senior Project Development II |
| Build Student Readiness Experience Builder | Build Group-Based Experience Builder | Build Volunteer Experience Builder |
| Create Company-Based Experience Builder | Create New Hire Experience Builder | Create Training Experience Builder |
